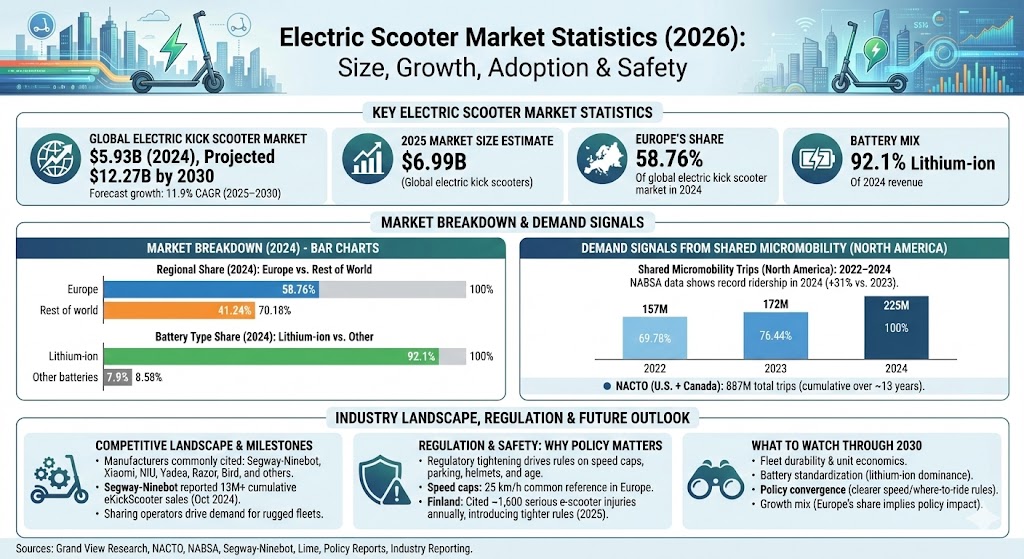
North America shared micromobility (NABSA):225M trips in 2024 (+31% vs. 2023) across 415 cities.
North America fleet size (NABSA):333,000 shared micromobility vehicles deployed in 2024.
North America mode counts (NABSA):85M e-scooter trips and 64M e-bike trips in 2024.
NACTO (U.S. + Canada):157M shared micromobility trips in 2023; 887M total trips over ~13 years (cumulative).
Segway-Ninebot: reported 13M+ global eKickScooter sales (cumulative) as of Oct 24, 2024.
Safety/regulation signal: Finland’s 2025 law cited about 1,600 serious e-scooter injuries annually and introduced tighter rules (including under-15 restrictions and a 25 km/h cap for rentals).
Global Electric Kick Scooter Market Size
Market Size (USD Billions): 2024 vs. 2025 vs. 2030 (Projected)
Year
Bar
Value
2024
$5.93B
2025
$6.99B
2030
$12.27B
Max = $12.27B. Widths: 2024 48.33%, 2025 56.97%, 2030 100.00%.
Market Breakdown
Regional Share (2024): Europe vs. Rest of World
Region
Bar
Value
Europe
58.76%
Rest of world
41.24%
Max = 58.76%. Widths: Europe 100.00%, Rest of world 70.18%.
Battery Type Share (2024): Lithium-ion vs. Other
Battery type
Bar
Value
Lithium-ion
92.1%
Other batteries
7.9%
Max = 92.1%. Widths: Lithium-ion 100.00%, Other batteries 8.58%.
Demand Signals From Shared Micromobility
Shared scooter programs are a major demand channel for durable, fleet-grade scooters (and a major visibility driver for consumer adoption). In North America, NABSA’s latest industry reporting shows record ridership in 2024, alongside continued electrification and growing e-scooter trip volumes.
Shared Micromobility Trips (North America): 2022–2024
Sharing operators as demand anchors: large fleets and long-term city permits push demand for more rugged frames, swappable/managed batteries, telemetry, and compliance features.
Regulation & Safety: Why Policy Matters to Market Growth
Regulatory tightening is increasingly a growth “gate.” The same issues driving adoption (speed, convenience, sidewalk conflicts) are also driving rules on speed caps, parking management, helmet requirements, intoxication limits, and minimum rider ages.
Speed caps: 25 km/h is a common regulatory reference point in Europe; exceeding it can trigger moped-style requirements in some jurisdictions.
Fines and enforcement: Barcelona set fines up to €500 for riding on pavements or without a helmet and reported ~44,000 e-scooter journeys per day.
Injury pressure: Finland cited ~1,600 serious injuries per year and introduced licensing/age restrictions for rental operations.
What to Watch Through 2030
Fleet durability + unit economics: designs that reduce maintenance and improve uptime tend to win city tenders and operator renewals.
Battery standardization: lithium-ion dominance suggests continued investment in safer packs, smarter BMS, and improved charging/handling procedures.
Policy convergence: clearer speed/where-to-ride rules and enforced parking management can expand rider acceptance—and stabilize operator deployment.
Growth mix: Europe’s large share today implies that policy shifts in major EU cities can materially swing global growth rates.