Electric scooters—especially shared e-scooters—are increasingly used for short, repeatable trips that look a lot like commuting (first/last-mile to transit, short errands on workdays, and peak-hour travel).
electric scooter commuting statistics
Key electric scooter commuting statistics
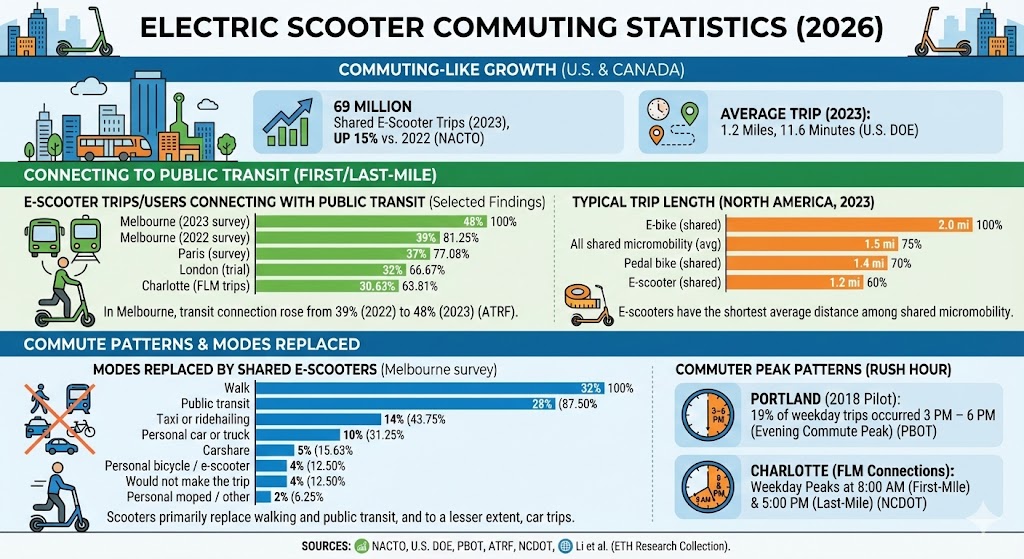
Shared e-scooter trips in the U.S. and Canada rose to 69 million in 2023 (up 15% vs. 2022), as total shared micromobility hit 157 million trips. (NACTO)
In North America (2023), the average shared e-scooter trip distance was 1.2 miles and the average duration was 11.6 minutes. (U.S. Department of Energy)
In Portland’s 2018 pilot data, 19% of all trips occurred between 3 p.m. and 6 p.m. on weekdays, described as an evening commute peak. (PBOT)
In Charlotte (shared e-scooter data matched to transit), first-mile connections were 14.82% and last-mile connections were 15.81% (about 30.63% combined), with weekday peaks at 8:00 a.m. (first-mile) and 5:00 p.m. (last-mile). (NCDOT research report)
In Melbourne Lime user surveys, the share of riders who used Lime to connect with public transport rose from 39% (2022) to 48% (2023). (ATRF 2024 proceedings paper)
How often e-scooters connect to public transit
Transit-linking is one of the clearest “commute-like” behaviors for e-scooters. Studies and surveys often measure this as either (a) riders saying they used a scooter to connect to public transport on that trip, or (b) trips inferred to be first/last-mile connections based on proximity to transit stops/stations.
Chart: E-scooter trips/users connecting with public transit (selected findings)
Label
Bar
Value
Melbourne (2023 survey)
48%
Melbourne (2022 survey)
39%
Paris (survey)
37%
London (trial)
32%
Charlotte (FLM trips)
30.63%
Max = 48%. Widths: Melbourne (2023 survey) 100.00%, Melbourne (2022 survey) 81.25%, Paris (survey) 77.08%, London (trial) 66.67%, Charlotte (FLM trips) 63.81%.
Typical shared e-scooter trip length for commuting-style travel
Even when scooters are used for commuting, the data usually shows short trips—often consistent with first/last-mile or short “within-neighborhood” commutes.
Chart: Average shared micromobility trip distance (North America, 2023)
Label
Bar
Value
E-bike (shared)
2.0 mi
All shared micromobility (avg)
1.5 mi
Pedal bike (shared)
1.4 mi
E-scooter (shared)
1.2 mi
Max = 2.0 mi. Widths: E-bike (shared) 100.00%, All shared micromobility (avg) 75.00%, Pedal bike (shared) 70.00%, E-scooter (shared) 60.00%.
What scooter trips replace during “commute-like” travel
Mode-shift surveys often show that scooters replace a mix of walking, public transit, and (to a smaller extent) private car/ridehailing. For commuting, the most important implication is whether scooters expand the practical reach of transit and reduce short car trips.
Chart: Modes replaced by shared e-scooters (Melbourne survey)
Label
Bar
Value
Walk
32%
Public transit
28%
Taxi or ridehailing
14%
Personal car or truck
10%
Carshare
5%
Personal bicycle / e-scooter
4%
Would not make the trip
4%
Personal moped / other
2%
Max = 32%. Widths: Walk 100.00%, Public transit 87.50%, Taxi or ridehailing 43.75%, Personal car or truck 31.25%, Carshare 15.63%, Personal bicycle / e-scooter 12.50%, Would not make the trip 12.50%, Personal moped / other 6.25%.
Portland (2018 pilot): A reported 19% of trips occurred during the weekday 3–6 p.m. window, described as an evening commute peak.
Charlotte (first/last-mile connections): Peak hours for identified transit-connection trips were 8 a.m. (first-mile) and 5 p.m. (last-mile) on weekdays.
Sources
NACTO — Shared Micromobility Report: 2023 (highlights page with trip totals and dockless scooter growth): https://nacto.org/publication/shared-micromobility-report-2023/
U.S. Department of Energy (Vehicle Technologies Office) — FOTW #1367 (Nov 4, 2024): average 2023 trip distances and durations by shared micromobility mode: https://www.energy.gov/eere/vehicles/articles/fotw-1367-november-4-2024-shared-micromobility-trips-north-america-averaged
Portland Bureau of Transportation — 2018 E-Scooter Pilot Findings (PDF): https://media.bizj.us/view/img/11193548/pbote-scooter01152019.pdf
Australasian Transport Research Forum (ATRF) 2024 Proceedings — Melbourne Lime survey findings on public transport connections and modes replaced (PDF): https://australasiantransportresearchforum.org.au/wp-content/uploads/2025/02/ATRF2024_Resubmission_39.pdf
North Carolina Department of Transportation (NCDOT) research — Final Report TA2025-06 (shared e-scooter first/last-mile connection identification in Charlotte): https://connect.ncdot.gov/projects/research/ResearchAnalysis/Final%20Report_TA2025-06.pdf
Li et al. (Transportation Research Part C, 2024) — Integrating shared e-scooters as the feeder to public transit (PDF via ETH Research Collection; includes summarized survey findings such as Paris and London integration shares): https://www.research-collection.ethz.ch/server/api/core/bitstreams/71e57ed9-c5a4-4474-8f60-5b31e55d0164/content