Electric scooter crashes are often driven by falls, surface hazards, speed, and night riding—and the resulting injuries disproportionately involve the head and upper limbs.
electric scooter accident statistics
Below are widely cited U.S. injury and fatality estimates, plus detailed findings from a major city injury investigation.
Key electric scooter accident statistics
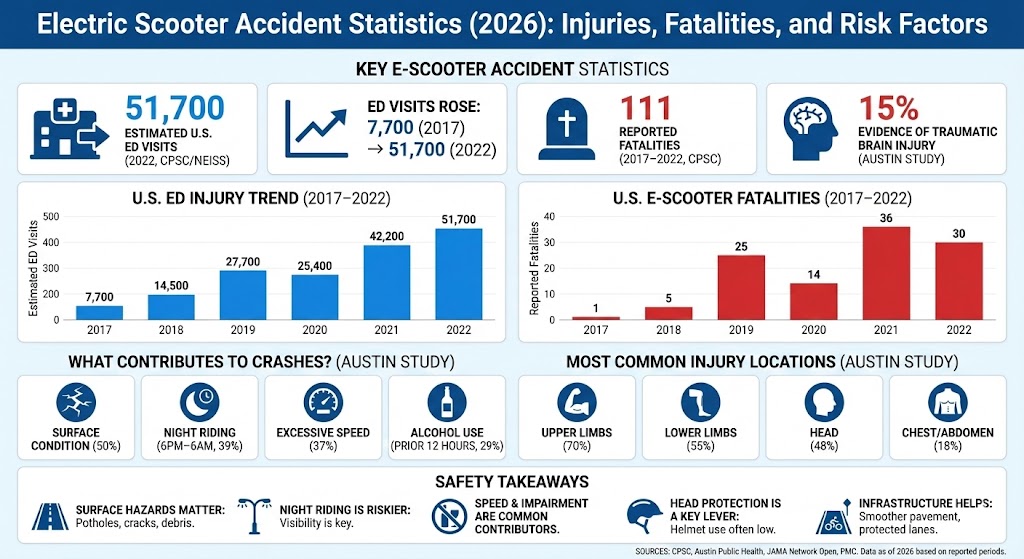
51,700 estimated U.S. emergency department (ED) visits for e-scooter injuries in 2022 (CPSC/NEISS).
Estimated ED visits for e-scooter injuries rose from 7,700 (2017) to 42,200 (2021) and 51,700 (2022).
CPSC reported 111 e-scooter fatalities in the U.S. across 2017–2022 (totals can update as records finalize).
Austin’s dockless e-scooter injury investigation found 15% of injured riders had evidence suggestive of traumatic brain injury, and 14% were hospitalized.
In Austin interviews, riders reported surface problems as a contributor (about half), excessive speed (more than one-third), and alcohol use in the prior 12 hours (about three in ten).
A U.S. multicenter ED case series (Southern California) reported 40.2% head injuries and 31.7% fractures among patients presenting after standing e-scooter incidents.
U.S. emergency department injury trend (CPSC/NEISS)
The U.S. Consumer Product Safety Commission (CPSC) uses NEISS data to estimate national ED-treated injuries. E-scooter injury ED visits increased sharply across 2017–2022, with 2022 the highest year in the series.
Chart: Estimated U.S. ED visits for e-scooter injuries (2017–2022)
CPSC compiles reported fatalities involving micromobility products. For e-scooters specifically, the highest annual count in 2017–2022 was in 2021 (36), with 2022 close behind (30). These totals can change as death certificate data and investigations are updated.
Chart: Reported U.S. e-scooter fatalities (2017–2022)
What contributes to e-scooter crashes? (Austin dockless rider interviews)
City-level investigations help explain why crashes happen. In Austin’s dockless e-scooter injury study (Sept–Nov 2018), riders commonly pointed to surface issues (e.g., potholes/cracks), night riding, speed, and alcohol use as contributing factors.
Max = 50%. Widths: Surface condition contributed 100.00%, Injured between 6pm–6am 78.00%, Excessive speed contributed 74.00%, Alcohol in prior 12 hours 58.00%, Collided with a motor vehicle 20.00%.
That same Austin report estimated an injury rate of 20 injured individuals per 100,000 e-scooter trips during the study period, based on local trip totals.
Most common injury locations
Across multiple datasets, head injuries and fractures show up repeatedly. In Austin’s investigation of 190 injured riders, injuries were frequently reported in multiple body regions—especially the upper limbs and head.
Chart: Austin dockless e-scooter injuries — body regions affected
Body region
Bar
Value
Upper limbs
70%
Lower limbs
55%
Head
48%
Chest/abdomen
18%
Max = 70%. Widths: Upper limbs 100.00%, Lower limbs 78.57%, Head 68.57%, Chest/abdomen 25.71%.
Helmet use and head injury risk
Helmet use varies widely by city, riding context, and measurement method (self-report, observation, or clinical documentation). In CPSC’s 2022 e-scooter special study tabulation, 13% of estimated ED-treated injuries involved riders reporting helmet use, while a majority reported using no safety equipment (or it was unspecified). City-specific studies can be much lower—Austin’s investigation found only 1 of 190 injured riders wore a helmet at the time of injury.
Safety takeaways (based on the patterns above)
Surface hazards matter: potholes, cracks, curbs, and debris show up repeatedly in rider reports.
Night riding is riskier: visibility and lighting become more important after dark.
Speed and impairment are common contributors: riders frequently report excessive speed, and alcohol use appears in multiple clinical and interview-based datasets.
Head protection is a key lever: head injury rates are consistently high across studies, while helmet use is often low.
Infrastructure helps: smoother pavement, protected lanes, and predictable riding space reduce fall and conflict risks.
Sources
U.S. Consumer Product Safety Commission (CPSC): Micromobility-Products-Related Deaths, Injuries, and Hazard Patterns (2017–2022). https://www.cpsc.gov/s3fs-public/Micromobility-Products-Related-Deaths-Injuries-and-Hazard-Patterns-2017-2022.pdf
Austin Public Health: Dockless Electric Scooter-Related Injuries Study (Sept–Nov 2018). https://www.austintexas.gov/sites/default/files/files/Health/Epidemiology/APH_Dockless_Electric_Scooter_Study_5-2-19.pdf
Farley KX et al. Estimated Incidence of Electric Scooter Injuries in the US From 2014 to 2019 (JAMA Network Open). https://jamanetwork.com/journals/jamanetworkopen/fullarticle/2770043
Trivedi TK et al. Injuries Associated With Standing Electric Scooter Use (PMC). https://pmc.ncbi.nlm.nih.gov/articles/PMC6484536/