Shared e-scooters (app-based, short-term rentals) are now a mainstream “last-mile” option in many cities. Below are recent, credible stats on trips, pricing, operator scale, and safety.
shared scooter statistics
Key shared scooter stats (latest available)
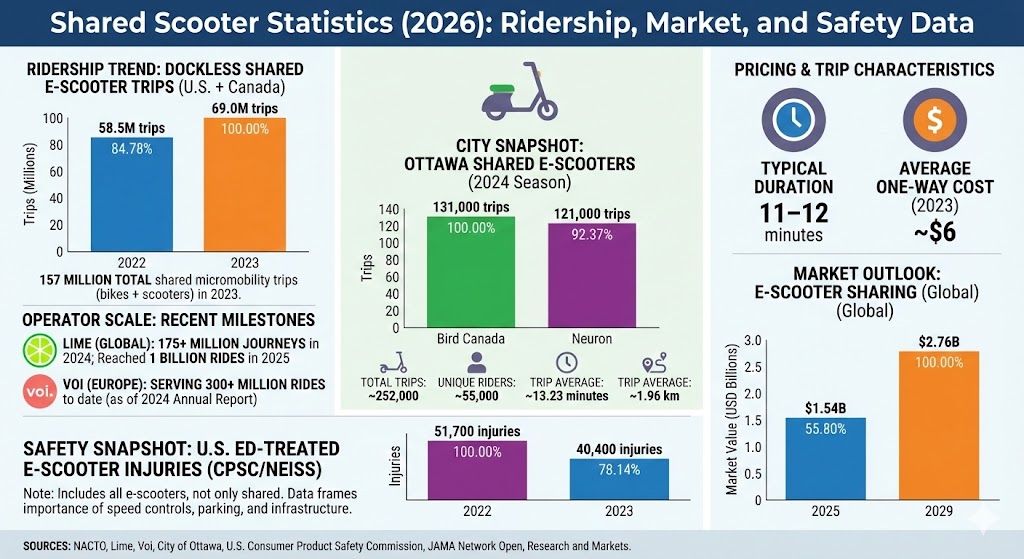
69 million dockless shared e-scooter trips were taken in the U.S. and Canada in 2023 (up from 58.5 million in 2022).
157 million total shared micromobility trips (bikes + scooters) were taken in the U.S. and Canada in 2023.
Typical dockless e-scooter trip duration is 11–12 minutes, and the average one-way dockless e-scooter trip cost was about $6 in 2023.
Lime reported 175+ million journeys in 2024 across 280+ cities in nearly 30 countries (bikes + scooters), including 234 million miles traveled.
Ottawa reported about 252,000 shared e-scooter trips in the 2024 season, split between Bird Canada (131,000) and Neuron (121,000).
U.S. CPSC/NEISS estimates (all e-scooters, not only shared): 51,700 ED-treated injuries in 2022 and 40,400 in 2023.
Max = 69.0M trips. Widths: 2022 84.78%, 2023 100.00%.
Pricing and trip characteristics
Shared scooters typically serve short urban hops, and pricing often combines an unlock fee plus per-minute charges. Recent reporting highlights two consistent patterns:
Short rides: typical dockless e-scooter trips are about 11–12 minutes.
Higher per-trip costs: average one-way dockless e-scooter trips were about $6 in 2023, with meaningful variation by city.
City snapshot: Ottawa shared e-scooters (2024 season)
Ottawa’s published season analysis provides a clear “city-scale” example of how shared scooters perform across a full operating period.
Total trips: ~252,000 in 2024 (Bird Canada 131,000; Neuron 121,000).
Unique riders: ~55,000 in 2024.
Trip averages: ~13.23 minutes and ~1.96 km per trip (reported seasonal averages).
Chart: Ottawa shared e-scooter trips by operator (2024)
Label
Bar
Value
Bird Canada
131,000 trips
Neuron
121,000 trips
Max = 131,000 trips. Widths: Bird Canada 100.00%, Neuron 92.37%.
Operator scale: recent milestones
Lime (global): reported 175+ million journeys in 2024 and announced reaching 1 billion rides worldwide in 2025.
Voi (Europe): reported serving 300+ million rides to date (as of its Annual Report 2024 materials).
Market outlook: e-scooter sharing (global)
Market sizing varies by methodology (revenue definitions, geography, and inclusion/exclusion of hardware). One widely cited estimate places the e-scooter sharing market at $1.54B in 2025, projected to reach $2.76B by 2029.
Chart: Global e-scooter sharing market value (estimate)
Label
Bar
Value
2025
$1.54B
2029
$2.76B
Max = $2.76B. Widths: 2025 55.80%, 2029 100.00%.
Safety snapshot: U.S. injury estimates (context for shared scooters)
Many injury datasets do not cleanly separate shared rentals from privately owned scooters. Still, national estimates help frame the importance of speed controls, parking management, and protected micromobility infrastructure.
Chart: Estimated U.S. ED-treated e-scooter injuries (CPSC/NEISS)
Label
Bar
Value
2022
51,700 injuries
2023
40,400 injuries
Max = 51,700 injuries. Widths: 2022 100.00%, 2023 78.14%.
The same CPSC report includes additional breakdowns and context (including hazard patterns and other micromobility product categories) that cities and operators can use to inform safety policies.
Voi — “Voi Technology Annual Report 2024” https://www.voi.com/investor/voi-technology-annual-report-2024
City of Ottawa — “E-scooter 2024 season data analysis” https://documents.ottawa.ca/sites/default/files/escooter_2024_analysis_en.pdf
U.S. Consumer Product Safety Commission — “Micromobility Products-Related Deaths, Injuries, and Hazard Patterns (2017–2023)” https://www.cpsc.gov/s3fs-public/Micromobility-Products-Related-Deaths-Injuries-and-Hazard-Patterns_2017-2023.pdf
JAMA Network Open — “Injuries With Electric vs Conventional Scooters and Bicycles” https://jamanetwork.com/journals/jamanetworkopen/fullarticle/2821387
Research and Markets — “E-Scooter Sharing Market Report 2025” https://www.researchandmarkets.com/reports/5980422/e-scooter-sharing-market-report