The scooter market is being shaped by rapid electric adoption, heavy Asia-Pacific concentration, and rising shared-mobility ridership in North America.
scooter market statistics
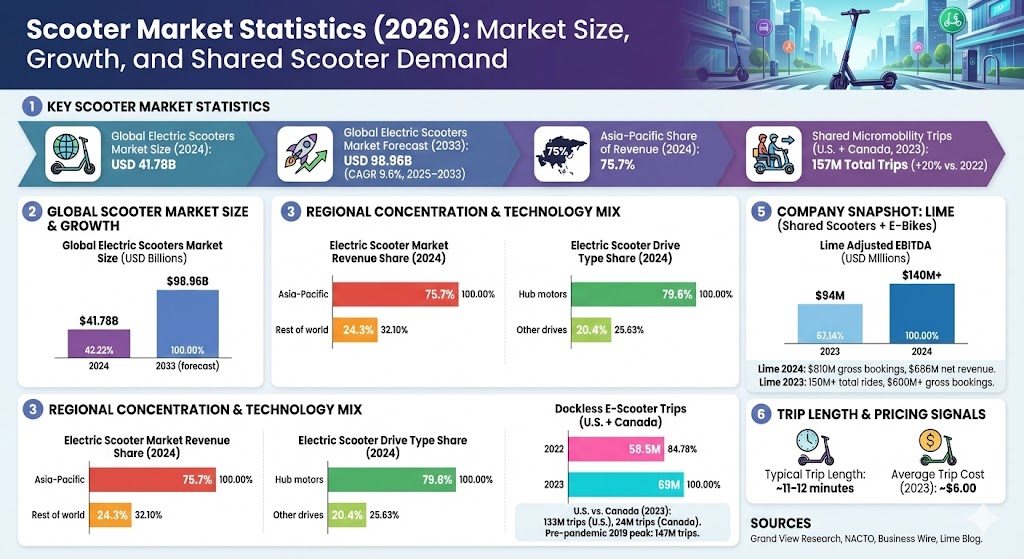
Below are the most-cited market size, share, and usage statistics from recent industry and city-transport reports.
Key Scooter Market Statistics
Global electric scooters market size (2024): USD 41.78B.
Global electric scooters market forecast (2033): USD 98.96B (CAGR 9.6%, 2025–2033).
Asia-Pacific share of electric scooters revenue (2024):75.7%.
Hub motors share (2024):79.6% of electric scooters revenue (drive type).
Shared micromobility trips (U.S. + Canada, 2023):157M total trips (new record).
Shared micromobility growth (2023 vs. 2022):+20%, surpassing the pre-pandemic 2019 peak.
Station-based systems trips (U.S. + Canada, 2023):81M (vs. 67M in 2022).
Lime (2024):$810M gross bookings and $686M net revenue; adjusted EBITDA over $140M.
Lime (2023):150M+ total rides and $600M+ gross bookings; adjusted EBITDA over $90M.
Global Scooter Market Size and Growth
Market-sizing varies by definition (standing “kick” scooters vs. seated scooters/mopeds and fleet scooters), but one widely cited estimate places the global electric scooters market at USD 41.78B in 2024, with a forecast to USD 98.96B by 2033.
Global Electric Scooters Market Size (USD Billions)
Year
Market size bar
Value
2024
$41.78B
2033 (forecast)
$98.96B
Max = $98.96B. Widths: 2024 42.22%, 2033 (forecast) 100.00%.
Regional Concentration
On the supply and demand side, electric scooters remain heavily concentrated in Asia-Pacific. One estimate puts Asia-Pacific at 75.7% of global electric scooter revenue in 2024.
Electric Scooter Market Revenue Share (2024)
Region
Share bar
Value
Asia-Pacific
75.7%
Rest of world
24.3%
Max = 75.7%. Widths: Asia-Pacific 100.00%, Rest of world 32.10%.
Technology Mix
In electric scooters, hub motors are a dominant drive configuration in 2024 (by revenue share in one estimate).
Electric Scooter Drive Type Share (2024)
Drive type
Share bar
Value
Hub motors
79.6%
Other drives
20.4%
Max = 79.6%. Widths: Hub motors 100.00%, Other drives 25.63%.
Shared Scooter Demand (U.S. and Canada)
City data shows shared micromobility (bikes + scooters) continued to grow. In 2023, 157 million trips were taken in the U.S. and Canada, up 20% from 2022. The same report states a cumulative 887 million shared bike and scooter trips have been taken over 13 years in the U.S. and Canada.
Shared Micromobility Trips (U.S. + Canada)
Year
Trips bar
Value
2022
130M
2023
157M
Max = 157M. Widths: 2022 82.80%, 2023 100.00%.
Dockless E-Scooter Trips (U.S. + Canada)
Year
Trips bar
Value
2022
58.5M
2023
69M
Max = 69M. Widths: 2022 84.78%, 2023 100.00%.
U.S. vs. Canada (2023): 133M trips in the U.S. and 24M trips in Canada (shared micromobility, bikes + scooters).
Dockless scooters rebound (2023): 69M trips in 2023 vs. 58.5M in 2022 (U.S. + Canada).
Pre-pandemic benchmark: the 2019 peak is cited as 147M trips (U.S. + Canada).
Company Snapshot: Lime (Shared Scooters + E-Bikes)
Lime is a leading shared micromobility operator and provides a useful public snapshot of unit economics and demand. In 2024, Lime reported $810M gross bookings, $686M net revenue, and adjusted EBITDA over $140M. In 2023, Lime reported 150M+ total rides, $600M+ gross bookings, and adjusted EBITDA over $90M.
Lime Adjusted EBITDA (USD Millions)
Year
EBITDA bar
Value
2023
$94M
2024
$140M+
Max = $140M+. Widths: 2023 67.14%, 2024 100.00%.
Trip Length and Pricing Signals
Typical dockless scooter / dockless e-bike trip length: often cited around 11–12 minutes (shared micromobility trip behavior).
Average dockless e-bike or e-scooter trip cost (2023): cited as around $6.00, with higher-cost examples in some markets.
Sources
Grand View Research – Electric Scooters Market Summary (2024 size, 2033 forecast, Asia-Pacific share, hub motor share): https://www.grandviewresearch.com/industry-analysis/electric-scooters-market
NACTO – Shared Micromobility in the U.S. and Canada: 2022 (130M trips in 2022; 58.5M dockless e-scooter trips in 2022; 2019 peak chart): https://nacto.org/wp-content/uploads/NACTO_sharedmicromobilitysnapshot_correctedNov3-2023-1.pdf
Business Wire – Lime 2024 unaudited results (gross bookings, net revenue, adjusted EBITDA): https://www.businesswire.com/news/home/20250218624910/en/Lime-Delivers-Record-Revenue-and-Profitability-Positive-Free-Cash-Flow-in-2024